11 min read
Revenue operations metrics give teams a shared language for measuring what is actually working.
Without them, decisions default to instinct, and instinct rarely scales.
Metrics connect the activity happening across sales, marketing, and customer success to the revenue outcomes leadership cares about. They surface where performance is slipping before it shows up in missed targets, and they give teams the evidence to make smarter resource decisions.
By tracking key RevOps metrics, your organization can gain insights into how your sales, marketing, and customer success (CS) teams are contributing to revenue growth. This makes it easier for your teams to identify opportunities to improve performance.
There is some overlap between sales metrics and RevOps metrics such as average deal size, but generally, RevOps metrics are looking at the big-picture revenue indicators. While sales metrics focus on sales rep performance.
Metrics tend to be low-level indicators that track activities or processes that are specific to a department or business area, such as sales, marketing, customer success, or RevOps.
Overall, effective metric tracking can lead to:
- Increased revenue performance
- Better decision-making and strategy
Drive business growth
Revenue operations metrics can help businesses to identify areas of opportunity, optimize resources, and accelerate revenue growth.
You can identify areas to optimize for improved performance by tracking key metrics such as conversion rate and lead generation. For example, by looking at conversion rates, you can understand which parts of the sales process are most effective and tweak those areas to increase revenue.
Analyzing average deal size can identify opportunities for your sales team to upsell or cross-sell to existing customers, leading to increased revenue.
 Ella Harrison
Enhance decision-making
RevOps metrics can also support decision-making and strategy development. By tracking key performance indicators (KPIs), you can gain insights into market trends, customer behavior, and the effectiveness of different strategies.
Your team can use this information to make more informed decisions about RevOps strategies to maximize your revenue growth. If you find your sales forecast is lower than expected for that term, you can support your sales reps to close more deals.
Or by tracking customer acquisition costs, you can determine which marketing channels are most effective and allocate your resources accordingly to generate leads cost-effectively.
The role of key performance indicators in revenue operations
As the name suggests, key performance indicators (KPIs) are measurable values that provide a way to evaluate the performance of revenue operations.
These indicators take a high-level perspective that represents cross-departmental goals. KPIs can help companies track progress towards their larger business goals, identify areas that need improvement and take corrective action to drive growth.
They can also allow teams to see what impact their metrics are having on the larger business goals.
Leore Spira
Revenue metrics
Revenue
Revenue tracks the amount of money your business is generating over a period of time. If you aren’t tracking your revenue, you essentially have no idea if your business has a consistent revenue flow.
You can track this as annual recurring revenue (ARR) or as monthly recurring revenue (MRR). 51.3% of revenue operations professionals agreed that recurring revenue (ARR/MRR) is the most important metric for engaging leadership.
“Overall, the number that the board and the CEO are looking for is annual recurring revenue (ARR).
“How is your ARR improving throughout the year? Are you going to hit your goal? Can you demonstrate sustainable growth over time? That's where we look for the hockey stick growth.
“There are lots of supporting metrics, but at the end of the day, that's the one that everybody is going to look at. ARR's the one that will determine what type of earnings your company gets long term.”
-Jordan Shaheen, Head of Revenue Operations at Candid
Revenue retention rate
Revenue retention rate helps you to understand how much of your customer base you’re retaining every month or year. This allows you to understand if you are keeping your customers or if they are downgrading their accounts or leaving after a few months.
Conversion rate
Conversion rate measures the percentage of leads that become paying customers. By tracking conversion rates, sales teams can identify areas to optimize their sales process and improve overall conversion rates.
Customer lifetime value (CLV)
Customer lifetime value measures the total revenue generated by a customer over their lifetime. Optimizing CLV can generate more revenue over the long term.
“CLV is a metric or an index that quantifies the amount of money an existing or perhaps a new customer is expected to spend while doing business with me over a duration of time.”
- Aymain Hussein, Director of Customer Success, Data AI & Advanced Analytics at Microsoft

Sales metrics
Sales pipeline velocity
Sales pipeline velocity allows you to see how quickly (on average) it takes leads to convert to paying customers through your sales funnel. But pipeline velocity isn’t measured by time, it’s measured by revenue.
Sales forecasting
The sales forecast predicts how much your sales team will sell within a given time period. This can help to predict how much revenue will be generated in the future.
Sales forecasting can also allow you to predict if the sales team will meet their targets in advance, allowing for problem mitigation before their revenue goals are missed.
Hannah Pegram
Average deal size
Average deal size measures the average revenue generated per deal. Increasing the average deal size can increase revenue without increasing the number of deals closed. This can be a cost-effective way to drive revenue growth.
To achieve this you could increase upsells or cross-sells of additional products to existing customers or target larger deals with higher revenue potential.
Win/loss ratio
This metric measures the ratio of deals won versus deals lost by your sales team. This can also be measured for individual reps to understand who your top sellers are and share their sales strategy with the team.
You can also offer support to sellers with a high loss rate through training and mentorship.
Greg Larsen
Marketing metrics
Marketing qualified leads (MQLs)
MQLs are leads that have made it through the marketing funnel and will be passed on to sales to continue their customer journey. The more MQLs marketing produces the more leads the sales team has to work with.
Customer acquisition cost (CAC)
Customer acquisition cost shows you how much it costs to gain a new customer. This includes factors such as marketing team salaries, advertising costs, and marketing software.
You can calculate your customer acquisition cost by dividing the total cost of customer acquisition by the total number of new customers acquired.
Patrick Reynolds
Cost per lead
Cost per lead measures the cost of generating a new lead. By optimizing cost per lead, your marketing teams can maximize the ROI of their marketing efforts and drive revenue growth more cost-effectively.
Campaign ROI
Campaign ROI measures the return on investment of marketing efforts. Tracking ROI can help you assess the effectiveness of your marketing strategies and allocate resources to the most profitable channels.
Customer success metrics
Customer churn
Churn rate indicates the percentage of customers who stopped paying for or using your services over a given period. If churn is high, you may need to rethink your customer onboarding sequences.
Customer satisfaction score (CSAT)
CSAT is a measurement of how satisfied your customers are with their experience using your product or service.
This can help CS teams understand the needs of their accounts by indicating when customers are likely to churn or even upgrade their accounts.
Net promoter score (NPS)
Net promoter score measures customer satisfaction and loyalty, with higher scores indicating greater satisfaction and loyalty. By tracking NPS, CS teams can identify areas to improve customer experience and increase customer satisfaction and loyalty.
This can include addressing common pain points or issues that may lead to low scores, improving communication and relationship-building with customers, or providing additional resources or support to address customer needs.

Aligning KPIs with business goals
Not all the metrics mentioned above will be important for your business or even relevant! That’s where selecting the right KPIs comes in.
To get the most value from KPIs, revenue operations teams need to ensure they are aligned with their organization's business goals. This is essential for the growth and success of any organization.
By aligning your KPIs with the business’ goals, your teams can track and monitor their progress towards achieving their objectives and make necessary adjustments to ensure they stay on track.
Setting SMART objectives
KPIs should be specific, measurable, achievable, relevant, and time-bound (SMART). This helps to ensure that KPIs are meaningful and aligned with business objectives and that teams can easily monitor and track progress towards their goals.
When setting SMART objectives, it is important to ensure that they are realistic and achievable within the timeframe. This will help to motivate teams and ensure that they are working towards goals that are challenging but possible.
This objective is specific, measurable, achievable, relevant, and time-bound.
Identifying relevant KPIs
Teams should identify KPIs that align with their specific business goals and keep them relevant for the entire organization. These indicators should be based on historical data, customer behavior, and market trends.
It is important to regularly review and update KPIs to ensure that they remain relevant and aligned with business objectives.
These KPIs will help to measure the effectiveness of customer service initiatives and identify areas for improvement.
Ensuring Cross-Functional Collaboration
Revenue operations teams should make sure to involve all stakeholders in the process of defining and monitoring KPIs. This helps to ensure that everyone is aligned towards the same goals and that KPIs are consistent across the organization.
This cross-functional collaboration will help to ensure that KPIs are relevant, accurate, and aligned with business objectives.
Monitoring success and analyzing data
Without tracking regularly, you may as well be flying in the dark, as you will have no idea if you are on track. This could lead you to reach the end of the quarter and wonder why you missed your targets.
So once KPIs are defined and aligned with the business objectives, RevOps teams need to monitor and analyze these metrics regularly, as this allows your strategy to shift to help you meet your goals.
Establishing a KPI dashboard
Teams can use visual dashboards to track and monitor KPIs in real time. These dashboards can be customized to specific business units or departments and can provide a quick overview of performance relative to goals.
The dashboard should be easily accessible and understandable for all stakeholders, including executives, managers, and front-line employees. This will ensure that everyone is on the same page and working towards the same goals.
Ella Harrison
Regularly reviewing KPI performance
Teams should regularly review KPI performance to track their progress over time and identify any patterns that may require changes to the existing strategy.
This review should be done at least weekly, if not more frequently.
It is important to ensure that the data being used to track KPIs is accurate and up-to-date. Any errors should be addressed quickly to avoid mistakes in other business areas due to inaccurate or incomplete insights.
Adapting metrics to changing business needs
As businesses grow and evolve, their KPIs should be updated to reflect changing goals and objectives. KPIs should be reviewed periodically, and the smart ones can be modified for effectiveness and relevance.
By monitoring and analyzing KPIs regularly, businesses can make informed decisions and take corrective actions when necessary. This helps to ensure that the business is on track to achieve its goals and objectives, and ultimately, drive revenue growth.
Final thoughts
There are lots of metrics you can track to understand the success of your RevOps strategy, but the key is to track the KPIs that align with your business goals.
It is also important to ensure that all key stakeholders are aware of what KPIs are being measured so that they can understand their priorities. Establishing a KPI dashboard can also be useful for visibility across departments.
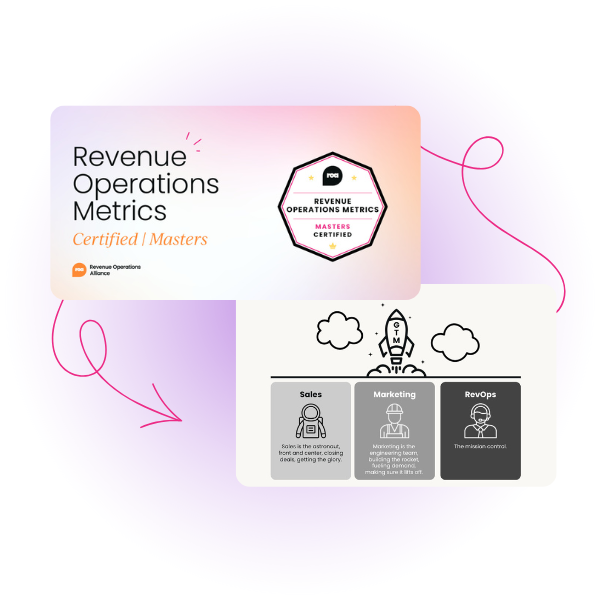
Unlock RevOps metrics mastery.
Take your revenue operations metrics game to the next level with our expert-led certification and gain the necessary knowledge to measure your RevOps impact with confidence.


Revenue operations alliance insider
Thank you for subscribing
Level up your revenue operations alliance career & network with revenue operations alliance experts.
An email has been successfully sent to confirm your subscription.
 Follow us on LinkedIn